E-commerce
3D Product Pages Reduce Returns by 40%. Here's the Data (and How to Set One Up)
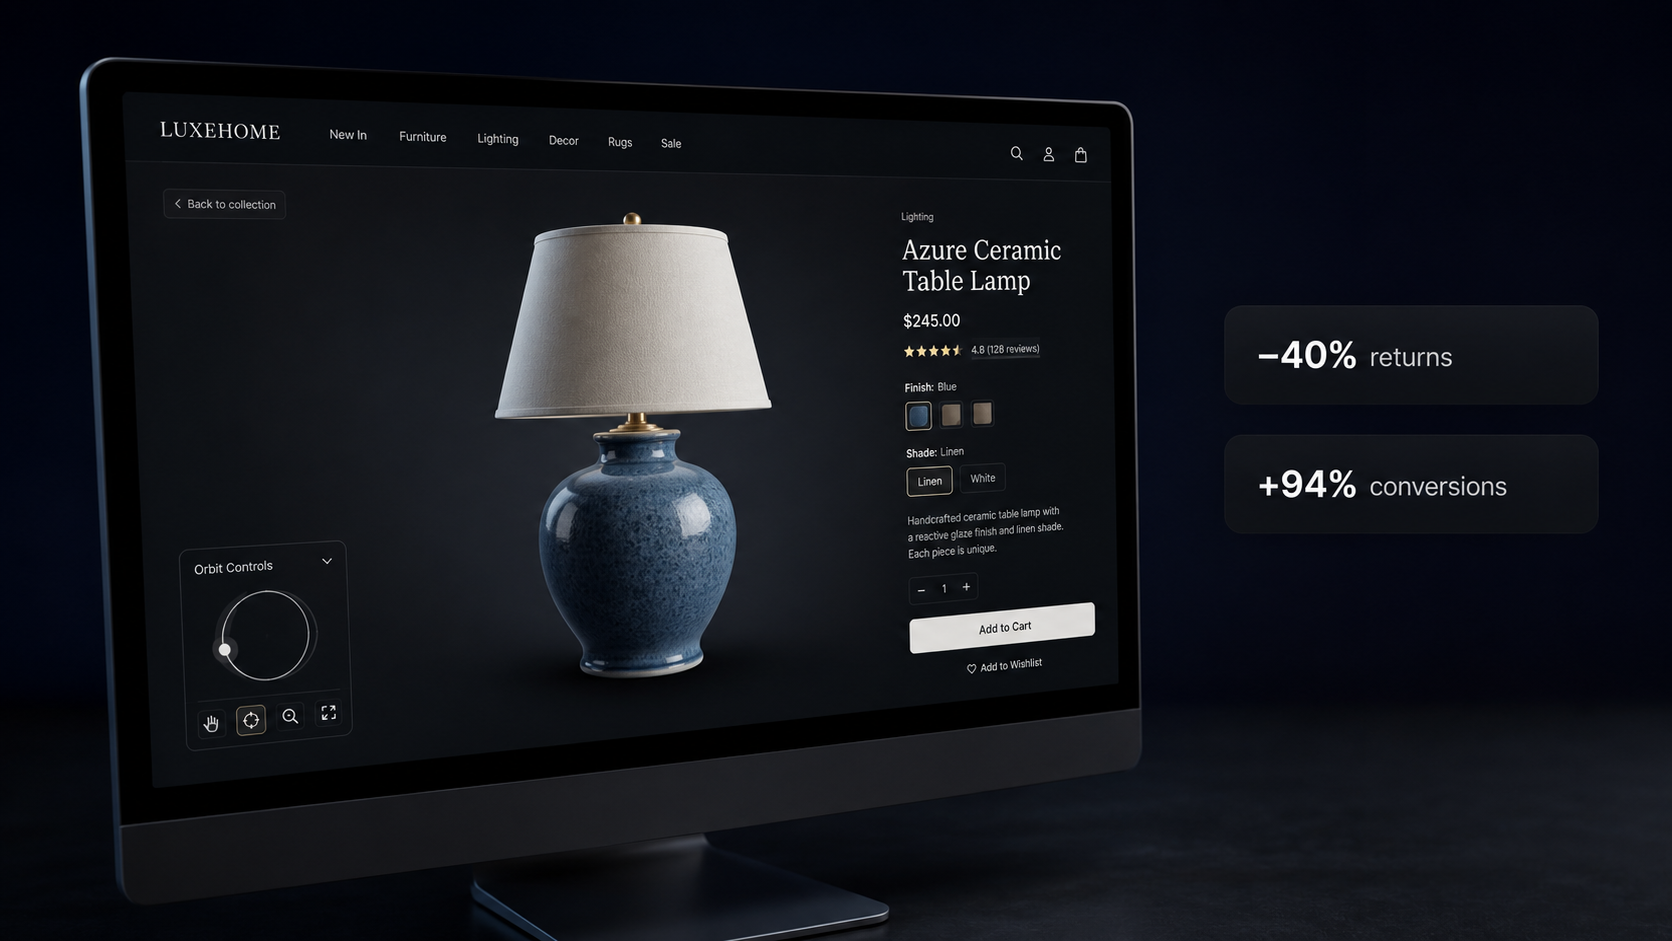
The numbers on 3D product pages are striking: 40% fewer returns, 94% conversion lift, 25% higher purchase likelihood. Here's what the data actually says and how to get these results without a 3D team or a developer.
Returns cost e-commerce brands roughly $816 billion a year globally. The biggest driver isn't fraud or damaged goods — it's the product looking different in real life than it did in the photos. Customers order based on two images from flattering angles in studio lighting. The thing arrives and it's... not quite what they pictured.
A flat JPEG can't show depth, or how a finish looks at an angle, or whether the backside has a seam you wouldn't want facing out. Customers fill in those gaps themselves. Sometimes they get it right. Sometimes they pay for return shipping.
Better photography doesn't fix this. It just makes better flat images. What actually works is letting customers rotate the product, zoom into the texture, see what it looks like from the back. That's what interactive 3D does — and the data on what it does to return rates is more striking than most brands realize.
The numbers
Shopify published data showing merchants who add 3D content to product listings see a 94% increase in conversions on average. Not a modest lift — roughly doubling the rate at which visitors become buyers.
On returns, adding a 3D viewer cuts return rates by an average of 40%, according to retailer studies by London Dynamics and Sketchfab. Customers who can inspect something from every angle before buying have fewer surprises when it arrives.
The purchase intent data is interesting for a different reason. Shoppers who interact with a 3D model show 64% higher purchase intent than those who only see standard images. There's something about rotating a product — even digitally — that creates a sense of ownership before the purchase. Two thirds of buyers say a 3D viewer makes them more confident, which matters most on high-priced items where hesitation is what kills the conversion.
One more number worth knowing: 82% of visitors actually interact with the 3D viewer when it's on the page. It's not something people scroll past.
What real brands saw
Stats from platform vendors are easy to dismiss because they always pick their best results. So here are numbers from specific brands with published case studies.
CB2 added 3D and AR to product pages and measured a 21% increase in revenue per visit and a 13% lift in average order size. The AOV increase is the more interesting figure. It suggests 3D doesn't just convert more people — it converts people who spend more, probably because reduced uncertainty makes bigger purchases feel less risky.
MADE.COM found that customers who viewed a 3D model were 25% more likely to buy than those who only saw flat images. For a furniture brand where returns involve dispatching a van to collect a sofa, that number matters.
EQ3 saw a 36% increase in conversions and an 88% increase in average order value. That 88% AOV figure keeps showing up across furniture brands and I'm not entirely sure how to explain it, except that people who can really look at something expensive before buying seem willing to spend more on it.
Where the effect is strongest
The returns and conversion numbers aren't uniform. They're biggest where product appearance drives most of the purchase decision.
Furniture sees the largest returns lift. Nobody can tell from two photos whether a sofa will look right in their living room, whether the fabric texture is something they'll hate up close, whether the legs are the right height. A 3D viewer answers those questions before checkout. Electronics do well on conversions for a simpler reason: people want to see ports, buttons, and actual scale before spending $300, and "where does the USB-C port go" shouldn't require a customer service email.
Apparel is harder. You need model quality high enough to show how fabric drapes, which requires better source material and a good AI pipeline. The conversion benefit is real but smaller than furniture.
Industrial and B2B products are the most underused category. Letting a buyer rotate a machined part or inspect a bracket is a meaningful trust signal when someone needs to verify dimensions before ordering — and it's the kind of thing that currently happens via a phone call or a PDF datasheet.
What this used to cost
Most brands don't have 3D on product pages not because they don't believe the data, but because the setup has historically been a project.
The standard path: hire a 3D artist to model each product ($150 to $500 per SKU), export to GLB, find somewhere to host the files, wire up a viewer library (Three.js, model-viewer, or a paid platform subscription), figure out how to get it into Shopify or Webflow without breaking the theme. For a large catalog that's a meaningful annual spend. CB2 and MADE.COM can justify it. Most brands can't, so they don't bother.
AI-generated 3D has changed the cost side of this significantly over the last year.
How to set one up
SphereLinks lets you upload a product photo, generate a 3D model, and get a hosted embed link — no 3D artist, no developer, no viewer library to configure.
Upload a photo at [spherelinks.io/models](https://spherelinks.io/models). Clear shots on a plain background with good lighting work best. Generation takes 30 seconds to a few minutes. When the model is ready, copy the iframe snippet from the model card.
In Shopify, paste it into the product description with the editor in HTML mode. In Webflow, drop it into an HTML embed block. In most CMS platforms, any block that accepts raw HTML works.
<iframe
  src="https://spherelinks.io/embed/{modelId}?autorotate=1"
  width="100%"
  height="500"
  frameborder="0"
  allow="fullscreen"
  allowfullscreen
  title="Product Name"
></iframe>
The viewer handles orbit (drag to rotate, scroll to zoom), auto-rotate, and fullscreen. Touch works without extra configuration. If you need a white background for a light-theme page, add ?bg=light. To strip out the UI buttons for a cleaner look, add ?controls=0.
What to actually expect
The 94% average conversion lift is an average across many products and price points, so your result will differ. A few things that actually move the needle:
Model quality. An AI-generated model from a single photo has imperfections — it's better than no 3D, but it's not the same as a hand-modeled asset. For the hero products driving most of your revenue, a higher-quality model is worth the cost. For a long tail of SKUs, AI-generated is a reasonable way to start getting coverage.
Placement. The 82% interaction rate assumes the viewer is visible on load, not buried below the fold. Treat it like your main product image. Below-fold viewers get ignored.
Mobile. Check that 500px height works on a phone screen — 400px usually does better for mobile-first layouts. The embed handles touch gestures, but viewport height is worth testing.
Running the test
Pick one or two products with high return rates or high revenue concentration, add 3D, and run it for four to six weeks. Compare conversion rate and return rate against the same period last year or against a comparable page without 3D.
If the results are even half of what CB2 and EQ3 saw, the math gets compelling quickly. A 20% reduction in returns on a product with a 15% return rate, combined with a meaningful conversion lift, changes the unit economics of that product. At that point adding 3D to more of the catalog isn't a marketing budget line — it's closer to cost reduction.
Free accounts on SphereLinks include generation credits and full embed access. Upload a photo, see what the model looks like, and get it on one product page. The numbers will either hold up on your store or they won't, and you'll know in a few weeks.
Ready to generate your first 3D model?
Upload an image and get a production-ready GLB file with PBR textures in under two minutes.
Start for free →More articles